Access to Vaccination Services
Te Ngira has produced maps at the SA2 level to show how spatial accessibility to Covid-19 vaccination services varies across Aotearoa.
These maps pull together vaccination service data from HealthPoint and vaccination rates from the Ministry of Health. The data underlying these maps is available for download to help Māori, Iwi, Pacific, and community organisations target their outreach at a micro-scale.
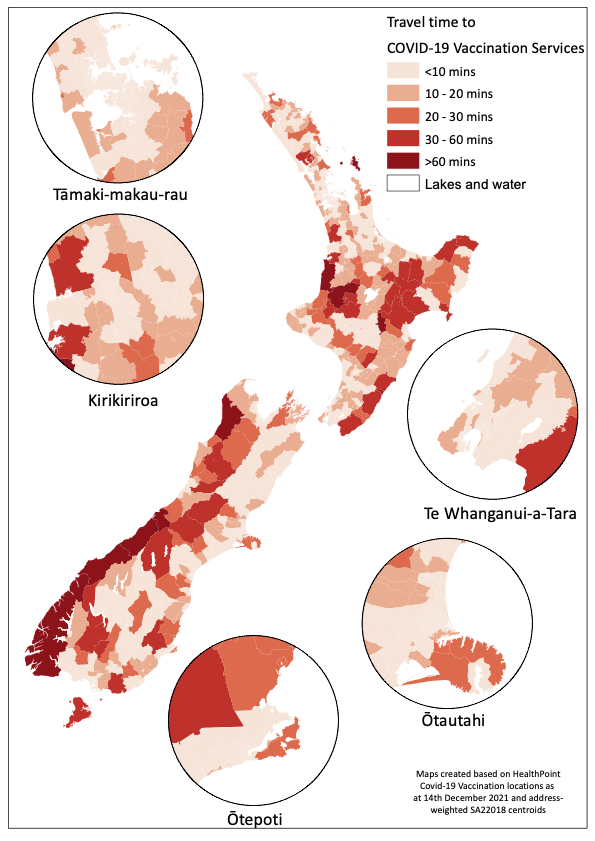
Map 1: Travel time to Covid-19 Vaccination Services
Map 2: Spatial access to Covid-19 Vaccination Services
Map 3a: Covid-19 Vaccination Rate - Total Population Dose 2
Map 4a: Covid-19 Vaccination Rate - Māori Dose 2
Map 5a: Covid-19 Vaccination Rate - Pacific Dose 2
Map 6: Median age for SA2 areas
8th October: CSV file for data on Covid-19 vaccination accessibility and rates at SA2
12th October: CSV file for data on Covid-19 vaccination accessibility and rates at SA2
19th October: CSV file for data on Covid-19 vaccination accessibility and rates at SA2
26th October: CSV file for data on Covid-19 vaccination accessibility and rates at SA2
2nd November: CSV file for data on Covid-19 vaccination accessibility and rates at SA2
9th November: CSV file for data on Covid-19 vaccination accessibility and rates at SA2
16th November: CSV file for data on Covid-19 vaccination accessibility and rates at SA2
24th November: CSV file for data on Covid-19 vaccination accessibility and rates at SA2
14th December: CSV file for data on Covid-19 vaccination accessibility and rates at SA2
It is important to contextualise and interpret neighbourhood-level vaccination rates carefully. Many places with ‘low’ levels of vaccination uptake also have low accessibility to vaccination services, significant distances to travel, and are also likely to have younger population age structures meaning that they have been eligible to receive the Covid-19 vaccination for a shorter period of time than other neighbourhoods.
For instance, Murupara has been identified in the media as the nation’s “slowest town”. However, town has one of the lowest levels of spatial access to vaccination services in the country, the nearest permanent vaccination site is a 50+ minute drive away, and the median age of the town in 2018 was 29 years.
We hope that these maps and the associated data will help to inform Māori, Iwi, Pacific and community organisations to quickly target their outreach at a more micro scale.
These maps and the associated dataset were produced using Ministry of Health SA2 vaccination rates and the locations of Covid-19 vaccination services (as at 6th October 2021) derived from the HealthPoint website using Nick Young’s code.
The distance and travel time between each SA2 and the nearest Covid-19 vaccination service was calculated in ArcGIS using the Closest Facility and OD-Matrix functions and Beer’s road network dataset.
A composite measure of spatial accessibility was also calculated using the Enhanced-Two-Step-Floating-Catchment-Area (E2SFCA) method. This approach takes into account the relative levels of service ‘supply’ and population ‘demand’ within 60 minute drive times to develop an accessibility score.